SQL Server 2005 Performance Dashboard
Posted by Dylan Beattie on 10 February 2009 • permalinkOne of those quick "this helped me, it might help you" posts. I've been trying to run SQL Server 2005 Performance Dashboard on one of our live servers, and hit a couple of snags along the way.
Having installed the dashboard reports and run the setup.sql script included with the download, I tried to view the report on one of our databases and got the following error:
Error: Index (zero based) must be greater than or equal to zero and less than the size of the argument list
Whoa. Bizarre - and rather unhelpful - error message. Clearly this Performance Dashboard thing hasn't been tested at all... and then it occurred to me that I was using SQL2008 client tools to talk to a SQL2005 server, but that the actual catalog (database) was still running in SQL2000 compatibility mode.

Trying exactly the same thing (right-click the database, Reports, performance_dashboard_main) using SQL Server 2005 Management Studio (instead of 2008 - same server, different version of the client tools) produces a far more helpful error message:
Error: Unable to display report because the database has a compatibility level of 80. To view this report, you need to use the Database Properties dialog to change the compatibility level to SQL Server 2005 (90).
So - over to the test server, bring up a test instance of the database, and change the compatibility level to 90. Database and apps still appear to be running fine, but trying to run the performance dashboard now produced the following error:
Error: Difference of two datetime columns caused overflow at runtime.
This time Google had the answer (thanks David) although it's not immediately clear what the solution is referring to. What you need to do is open the Setup.SQL script (which is installed along with the performance dashboard - you'll find it at C:\Program Files\Microsoft SQL Server\90\Tools\PerformanceDashboard\). Find line 276, which says:
sum(convert(bigint, datediff(ms, login_time, getdate()))) - sum(convert(bigint, s.total_elapsed_time)) as idle_connection_time,
and replace this line with
sum(convert(bigint, CAST ( DATEDIFF ( minute, login_time, getdate()) AS BIGINT)*60000 + DATEDIFF ( millisecond, DATEADD ( minute, DATEDIFF ( minute, login_time, getdate() ), login_time ),getdate() ))) - sum(convert(bigint, s.total_elapsed_time)) as idle_connection_time,
As David explains on the linked thread, DATEDIFF is returning an int (here, it's calculating the number of milliseconds between two DATETIME instances) - so any connection that's been active for longer than ~24 days will overflow an INT when you try and convert the connection time to milliseconds.
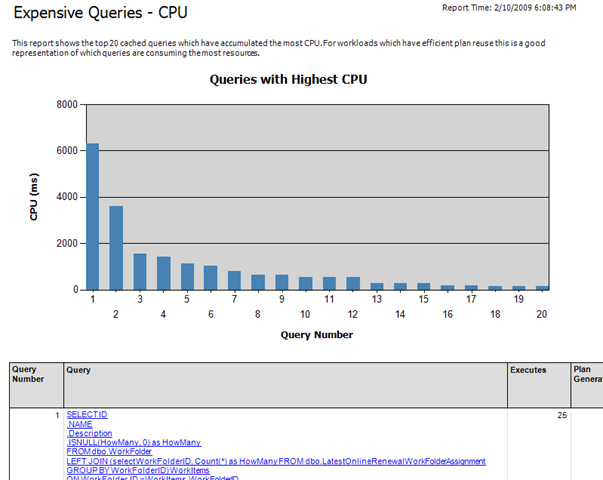
Anyway, change that line, run setup.sql again, and it works - acres of lovely statistical goodness at my fingertips:
Next step - make sure the SQL 2005 compatibility hasn't broken anything, then modify the compatibility level on the live server, and then I'll be able to get some real live performance stats based on actual web traffic, which should make for interesting reading.